
TN Special Election Irregularities
District 7 continues to show signs that could indicate foul play


Davidson County Tennessee - Was a Democratic Stronghold Choked?
In out first Substack on the Tennessee District 7 Congressional Special Election that was held on December 2nd, we showed demographic data that illustrated what a Democratic stronghold it is. If you can affect the Democratic Turnout there - it can make a big difference. We had 3 data analysts look at the election results in Davidson County and all 3 analysts saw signs that the two candidate’s vote shares were strongly correlated to voter turnout.
As we discussed in that first report, unless there is a demographic explanation, there’s no reason for a candidate to keep getting a larger and larger vote share as turnout increases.
We actually had a fourth data analyst look at the Davidson County demographics, and he saw nothing that could explain this correlation. In fact, he found one precinct that looked particularly suspect.
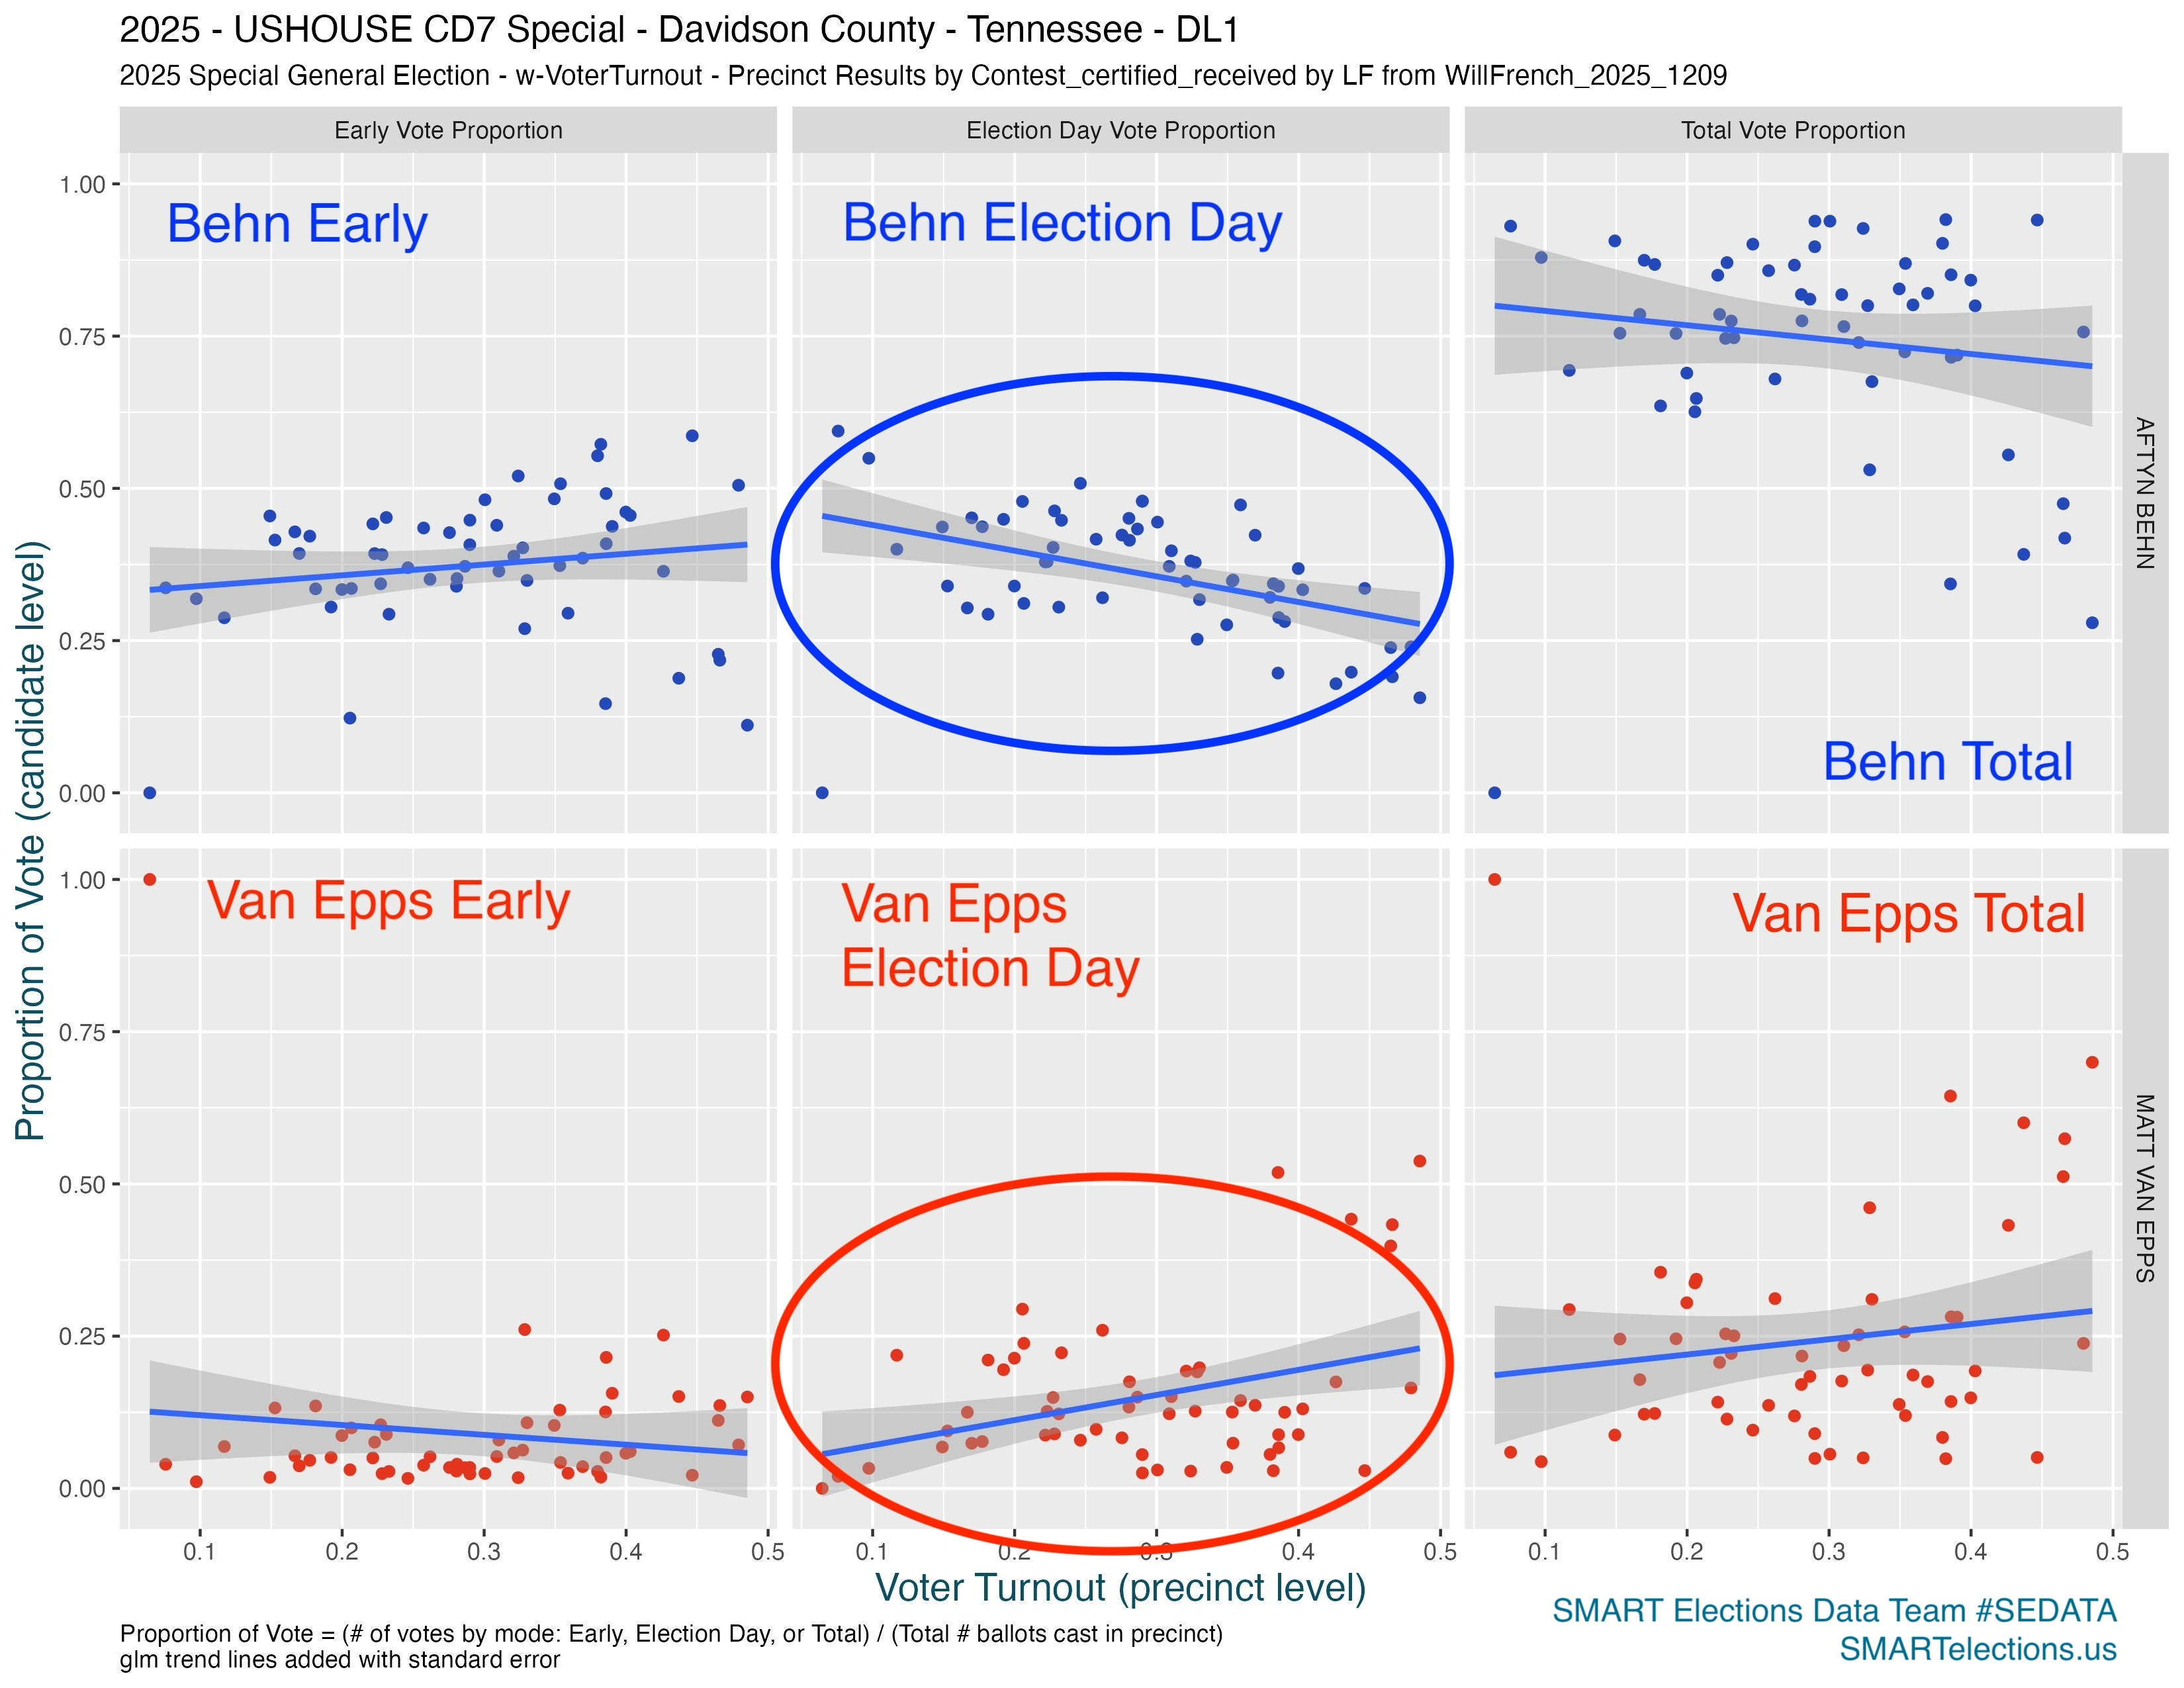
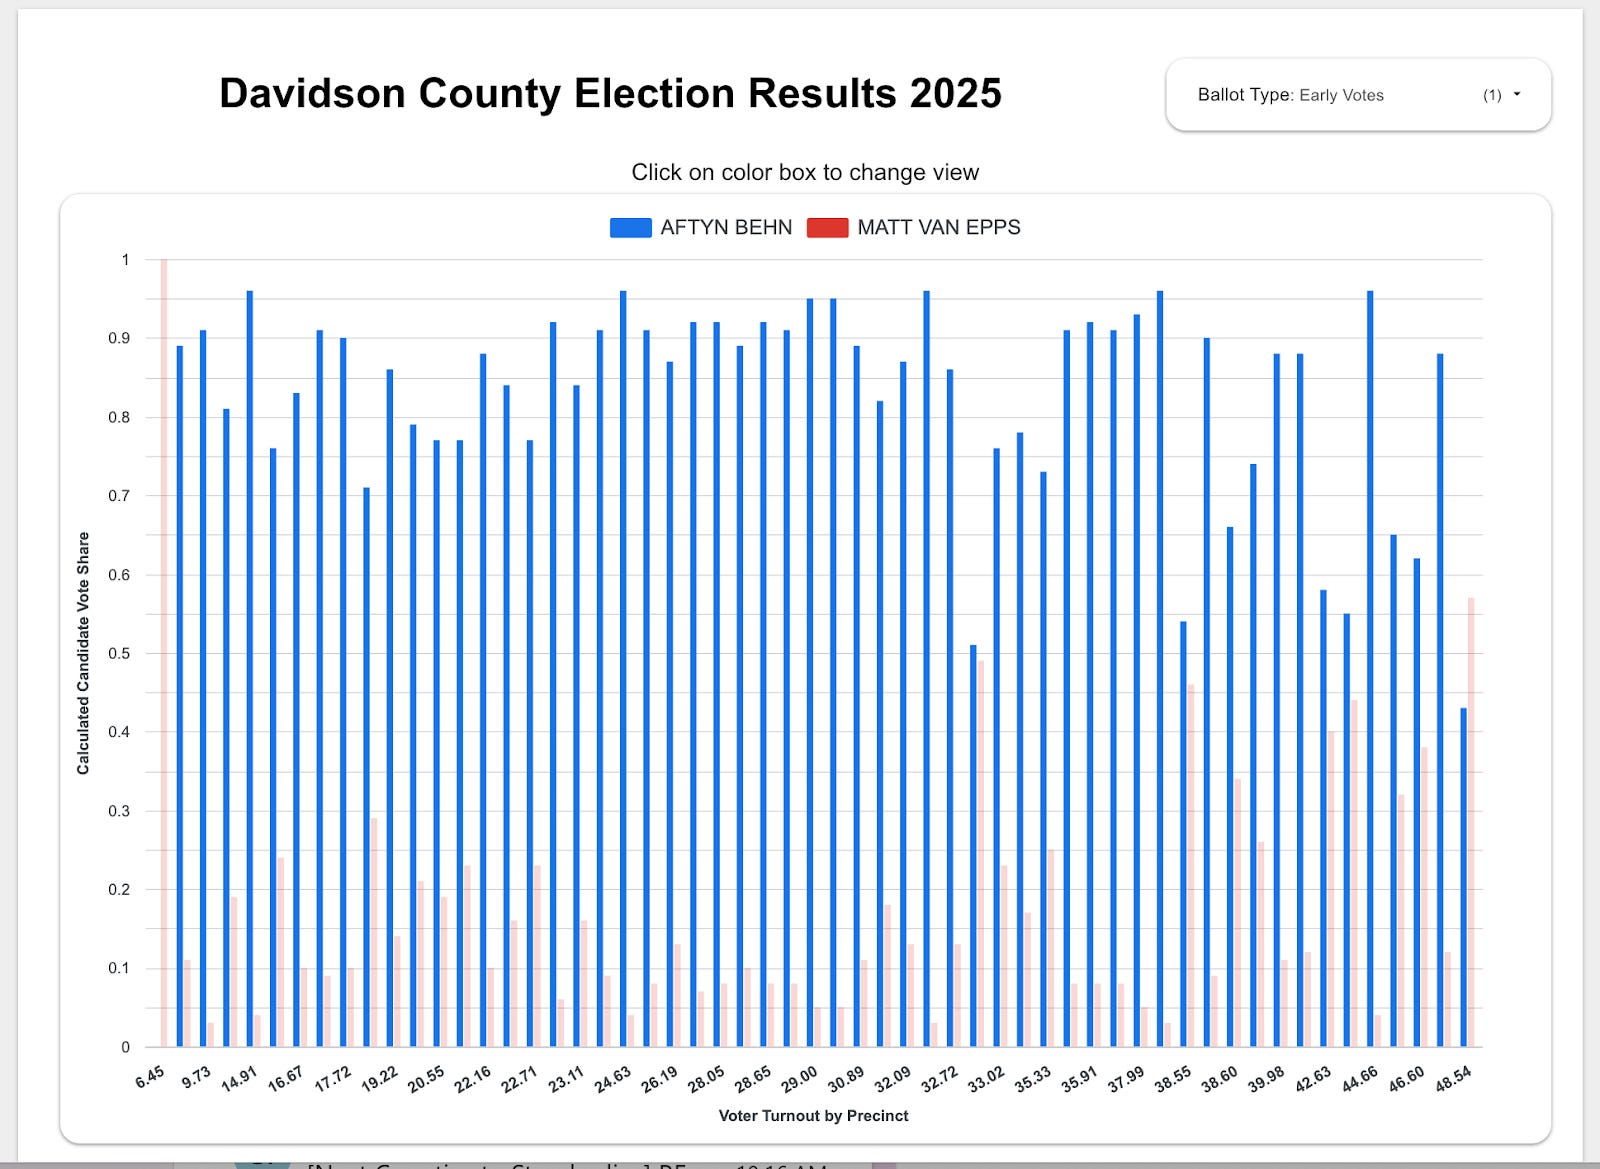
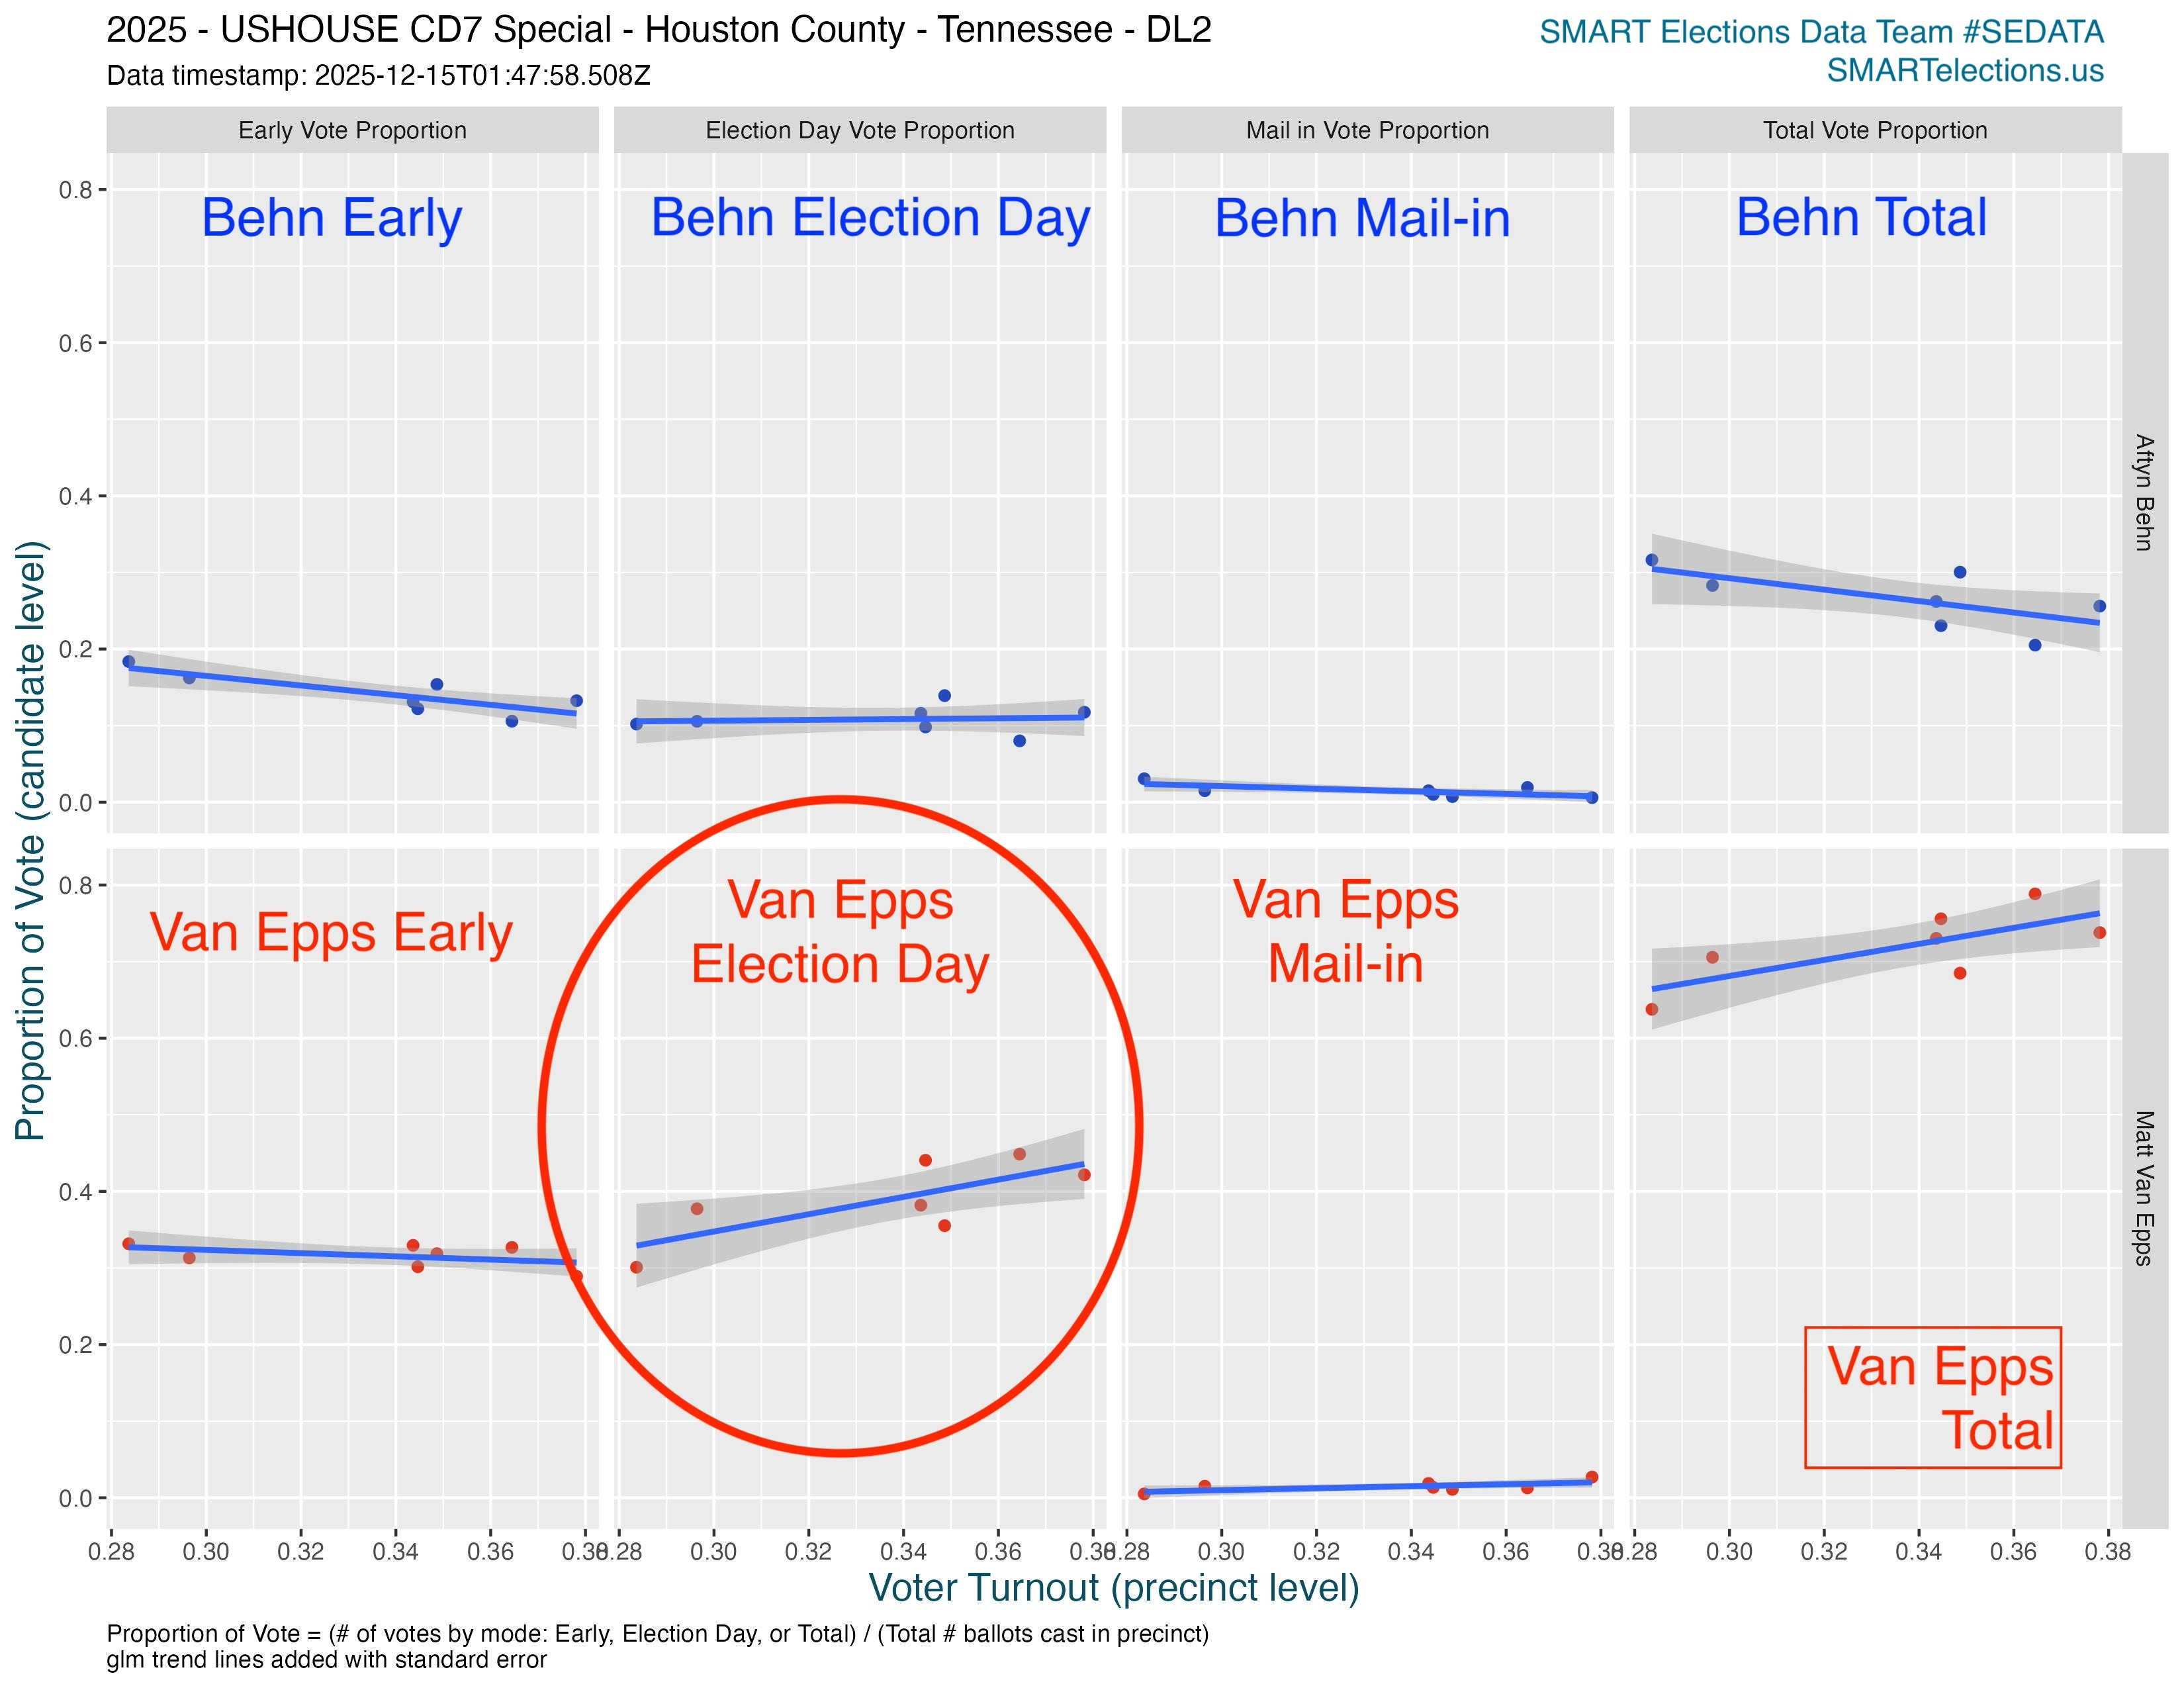
In the graph below, we show: as turnout increases, Behn, the Democratic candidate sees her vote share go down sharply. As the turnout increases, Van Epps, the Republican candidate sees his vote share increase sharply. This is most pronounced on Election Day voting. The pattern does not appear in mail-in voting.
Because the slopes are so steep, show such a strong correlation to turnout, and progress in a mathematically sequential pattern, there is the possibility that this is a vote changing algorithm, programming how the votes are counted in the voting machines, the election management system, or the election night reporting software.
Analysis by SMART Elections Data Team #SEDATA
We love for you to share our data & graphics!
Please link to our website and say:
Graphics & Analysis by the SMART Elections Data Team #SEDATA
SMARTelections.us
The SMART Elections Data Team (#SEDATA) is a dedicated and talented team that has developed a meticulous method to accurately extract and process election data. If you love to work with data and this topic interests you - join us!
Our process includes gathering certified data from a first-hand source, such as a state or county election website or commission. Then, two separate members of the SMART Elections Data Team independently extract or parse the data. A quality assurance team member compares the two data sets to ensure they match. This process confirms that the data we’re using is the official certified county or state data. We also share data with other teams, including the Election Truth Alliance.
In this case, we received the data primarily via public records requests from counties in District 7.
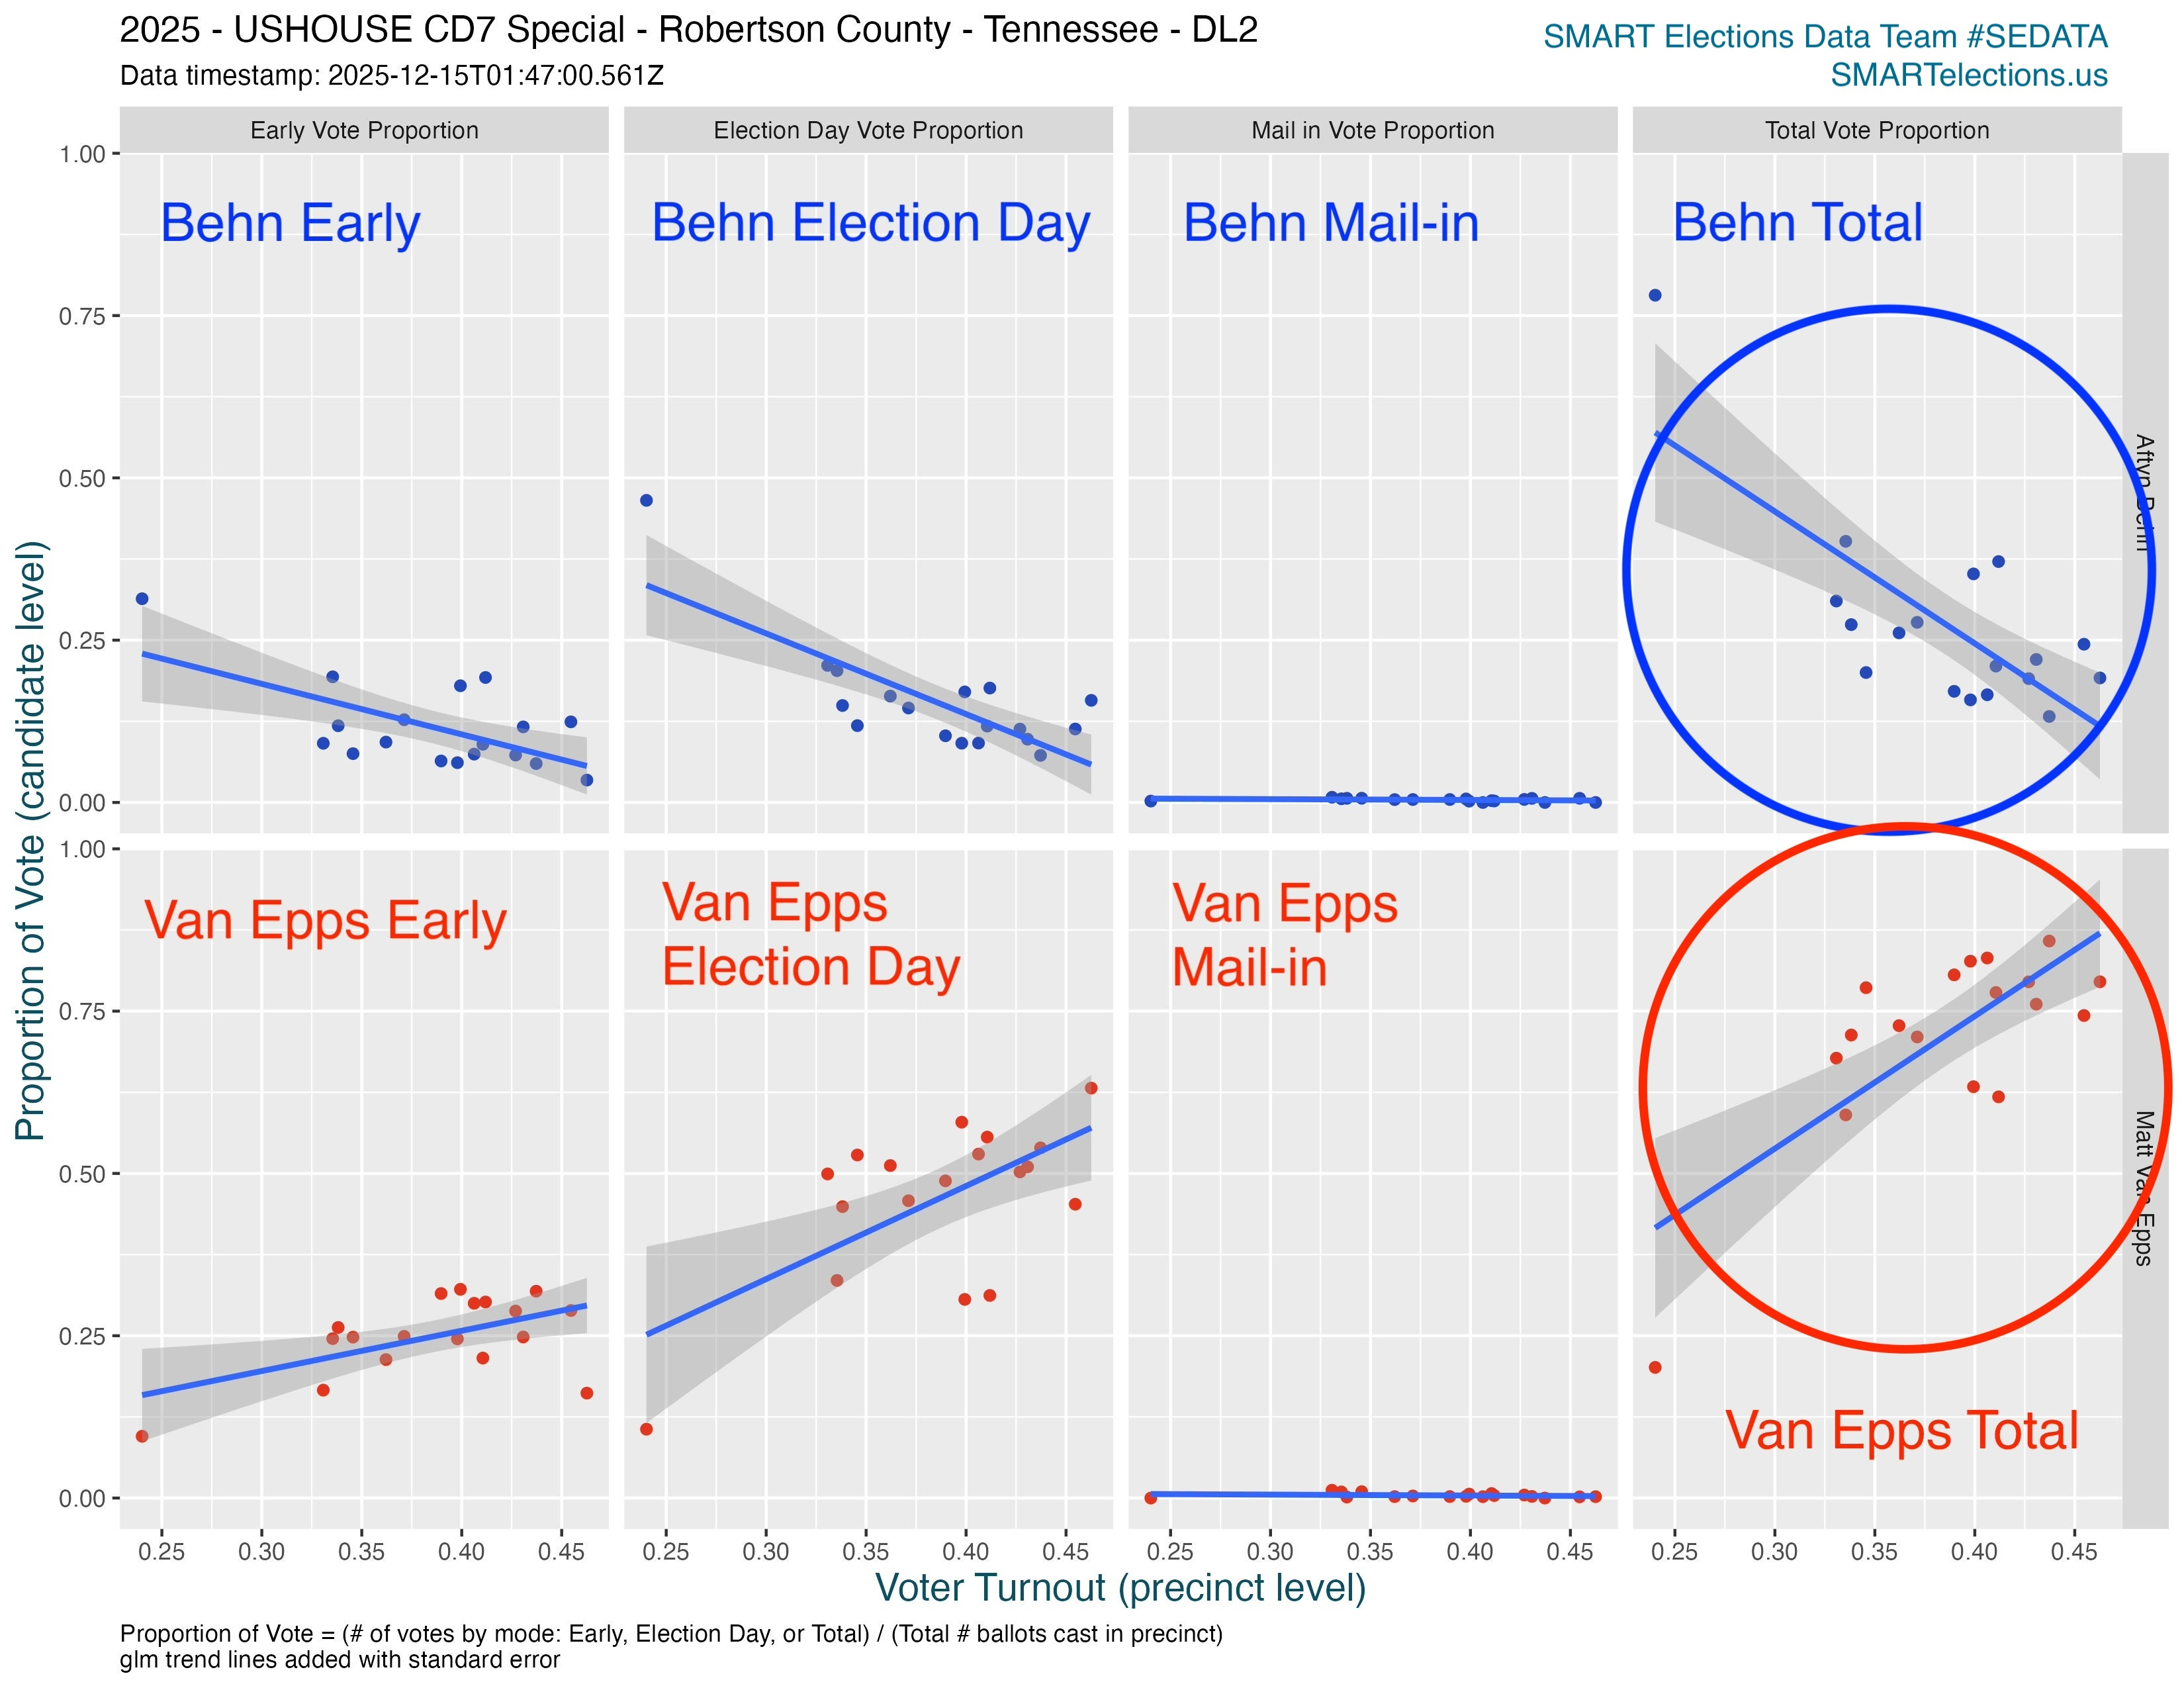
Data Pattern Is Similar to Montgomery County, TN
The correlation that we found in Davidson County is similar to the one that Election Truth Alliance found in another large county in the district, Montgomery County. The patterns in Davidson County are not as extreme as those in Montgomery County, but they are clear, and deserve to be investigated.
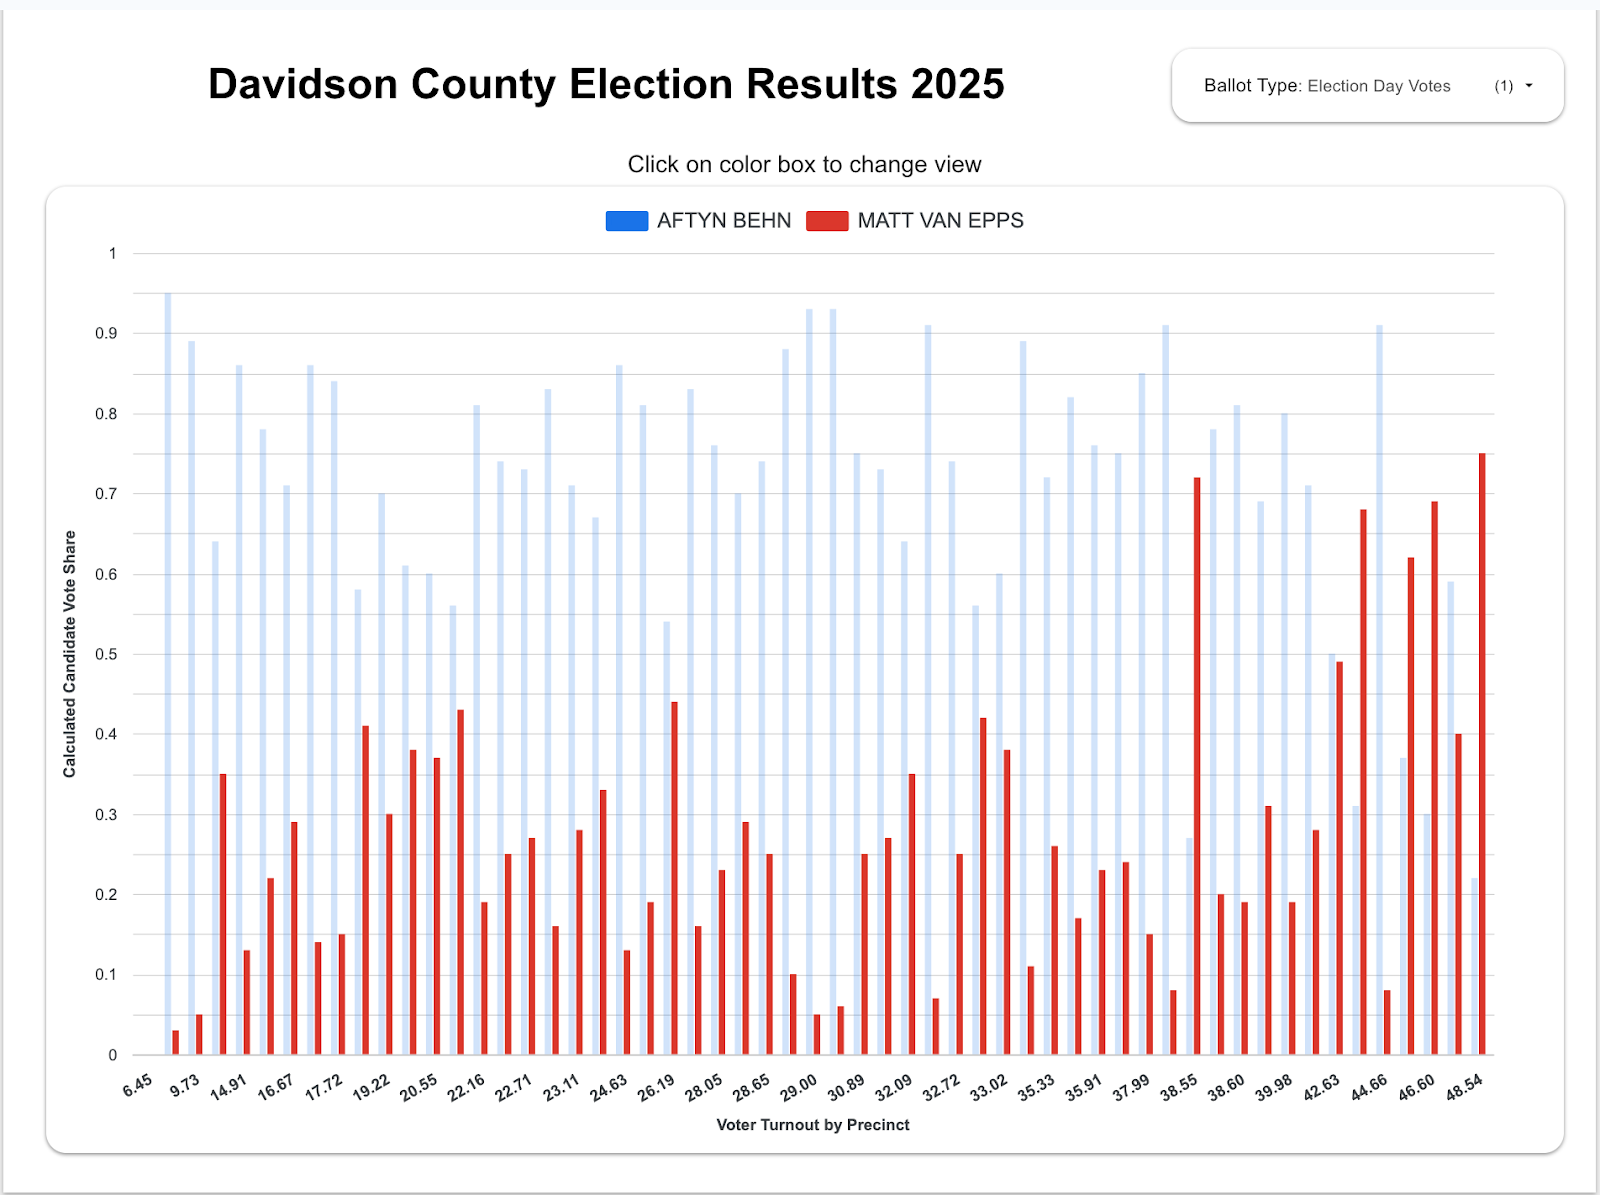
Interactive Graph Makes Pattern Even More Clear
One of our other team members found an innovative and very useful way to view the data. She created an interactive bar chart graph where you can look at the patterns yourself. Take a look!
You can click through different views to see the comparison
You can click on the blue and red color squares to see just one candidate, the other candidate, or both.
The graph is by an exceptional data analyst and SMART Elections Data Team Member, Holly W.
Holly W. Bio | During the pandemic, Holly used the statistical training from her degree in cognitive and abnormal psychology to transition from healthcare to data analysis. Since then, she has worked as a marketing and financial analyst. She is passionate about election security and advocating for transparency in the voting process.
Election Day - Behn
On Election Day, Behn receives very high support in low to medium turnout precincts, but as turnout increases, her vote share plummets in some high-turnout precincts. In these precincts, Behn’s support drops from a high of 93% to a low of 22%
High vote shares in low to medium turnout precincts for Behn include:
95%
93% (2 precincts)
91% (3 precincts)
89% (2 precincts)
Until 38% voter turnout, there is no precinct in which Behn receives less than 50% vote share. Suddenly at 38.55% turnout her vote share drops to 27%.
Low vote shares in high turnout precincts for Behn include:
22%.
27%
30%
31%
37%
Below you can view a still image of the graph.
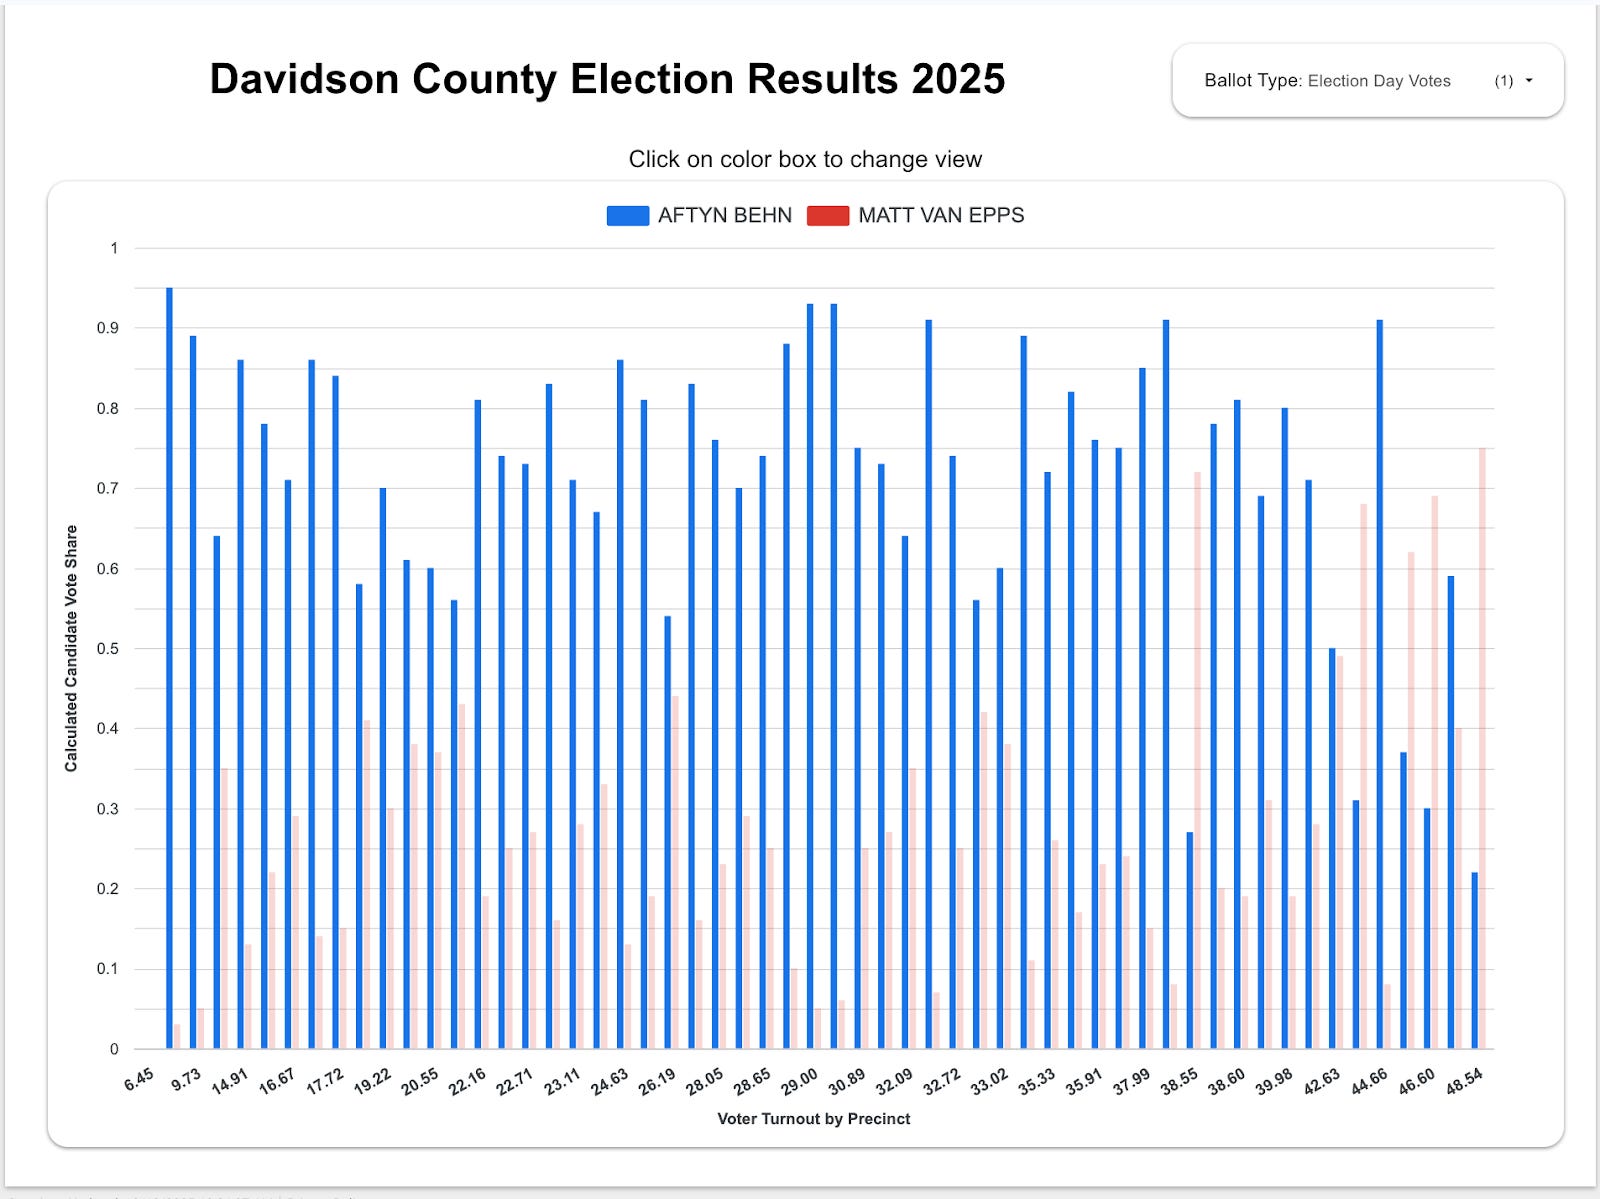
Election Day - Van Epps
On Election Day in some high turnout precincts, Van Epps’s support rises from a lows of
.03% (less than 1%) to a high of 75%
Low vote shares in low to medium turnout precincts for Van Epps include:
3%
5%
6%
7%
8%
11%
Until 38% voter turnout, there is no precinct in which Van Epps receives more than 46% vote share. Suddenly at 38.55% turnout his vote share sharply increases to 65%.
High vote shares in high turnout precincts for Van Epps include:
70%
65%
60%
57%
51%
Early Voting - Van Epps
The same patterns are also present in Early Voting and are especially dominant in Van Epps vote share which goes from low scoring precincts of 3% in low to medium turn-out precincts to a high of 57% in the precinct with the largest turnout.
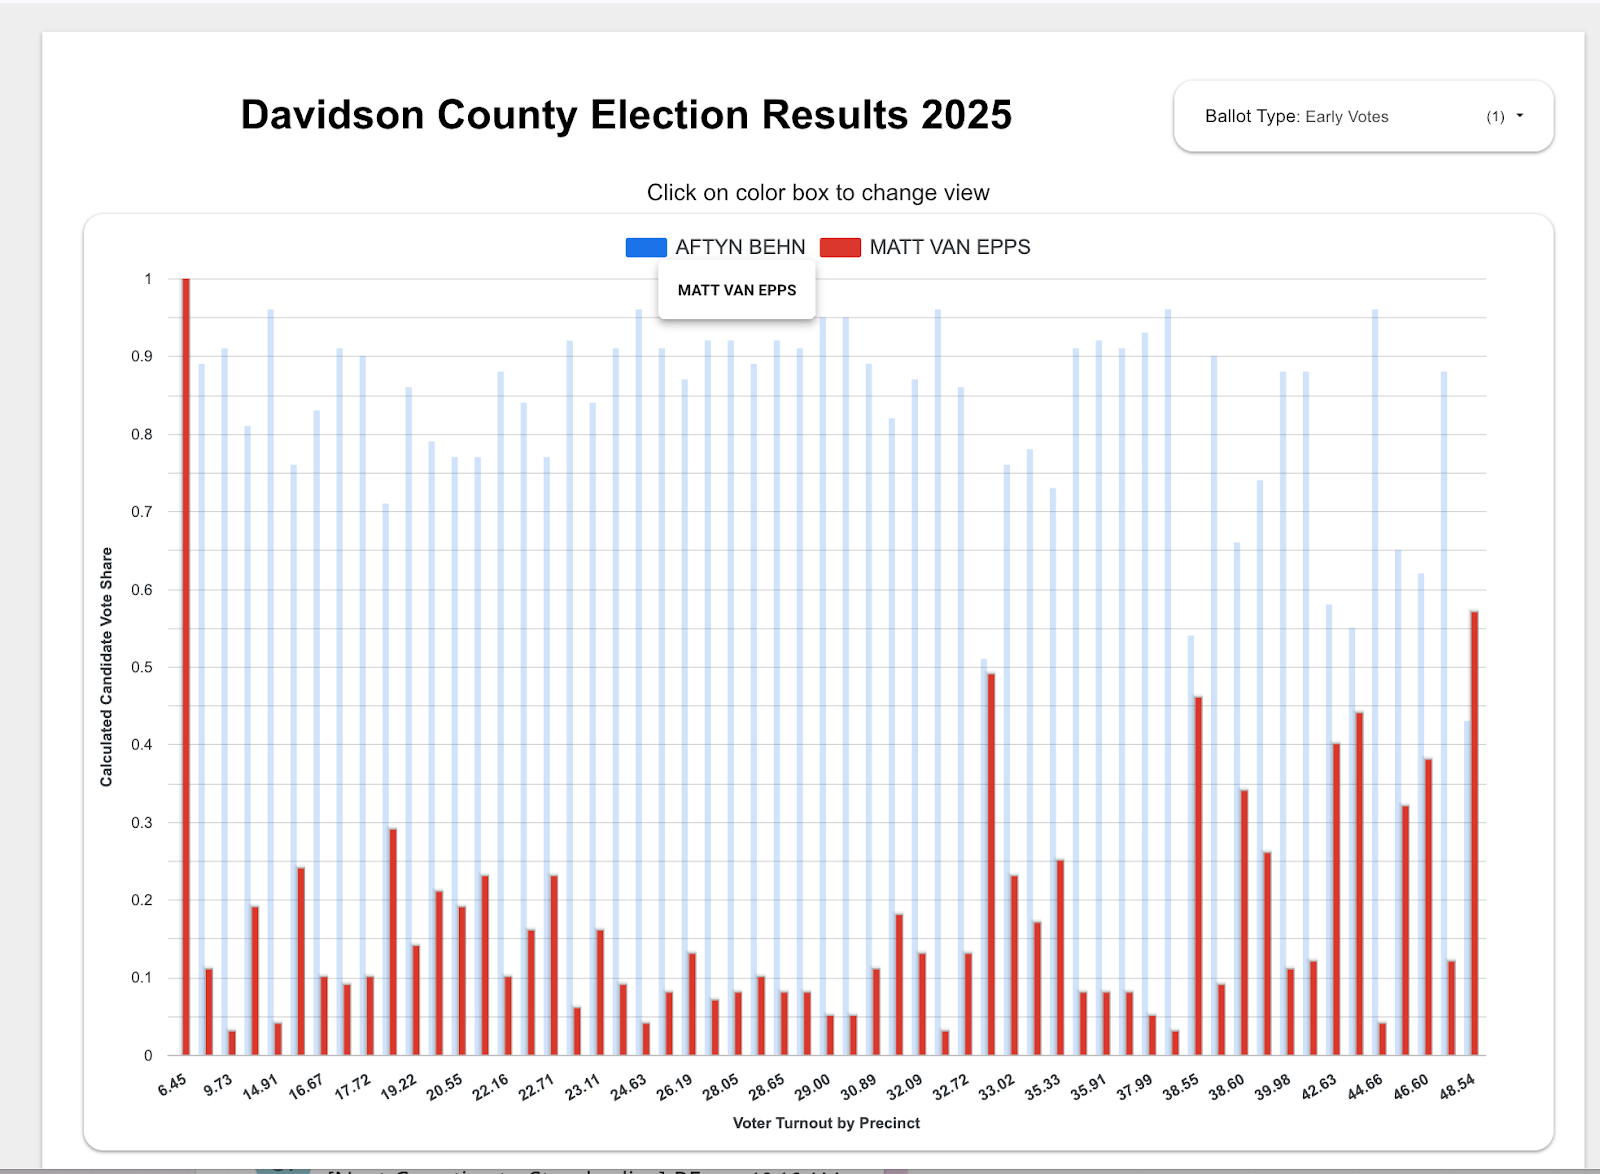
Early Voting - Behn
In Early Voting, Behn’s vote share deterioration is not as pronounced as in Election Day voting, however there is a clear shift in the results as turnout increases. Up until 32% there is no precinct where she receives less than 71%, and many precincts show a high vote share of 92 - 96%.
After the precincts hit 32% turnout, is the first time that she receives only 51%, and following that there are a series of precincts where her vote share goes to:
55 %
54 %
43 %
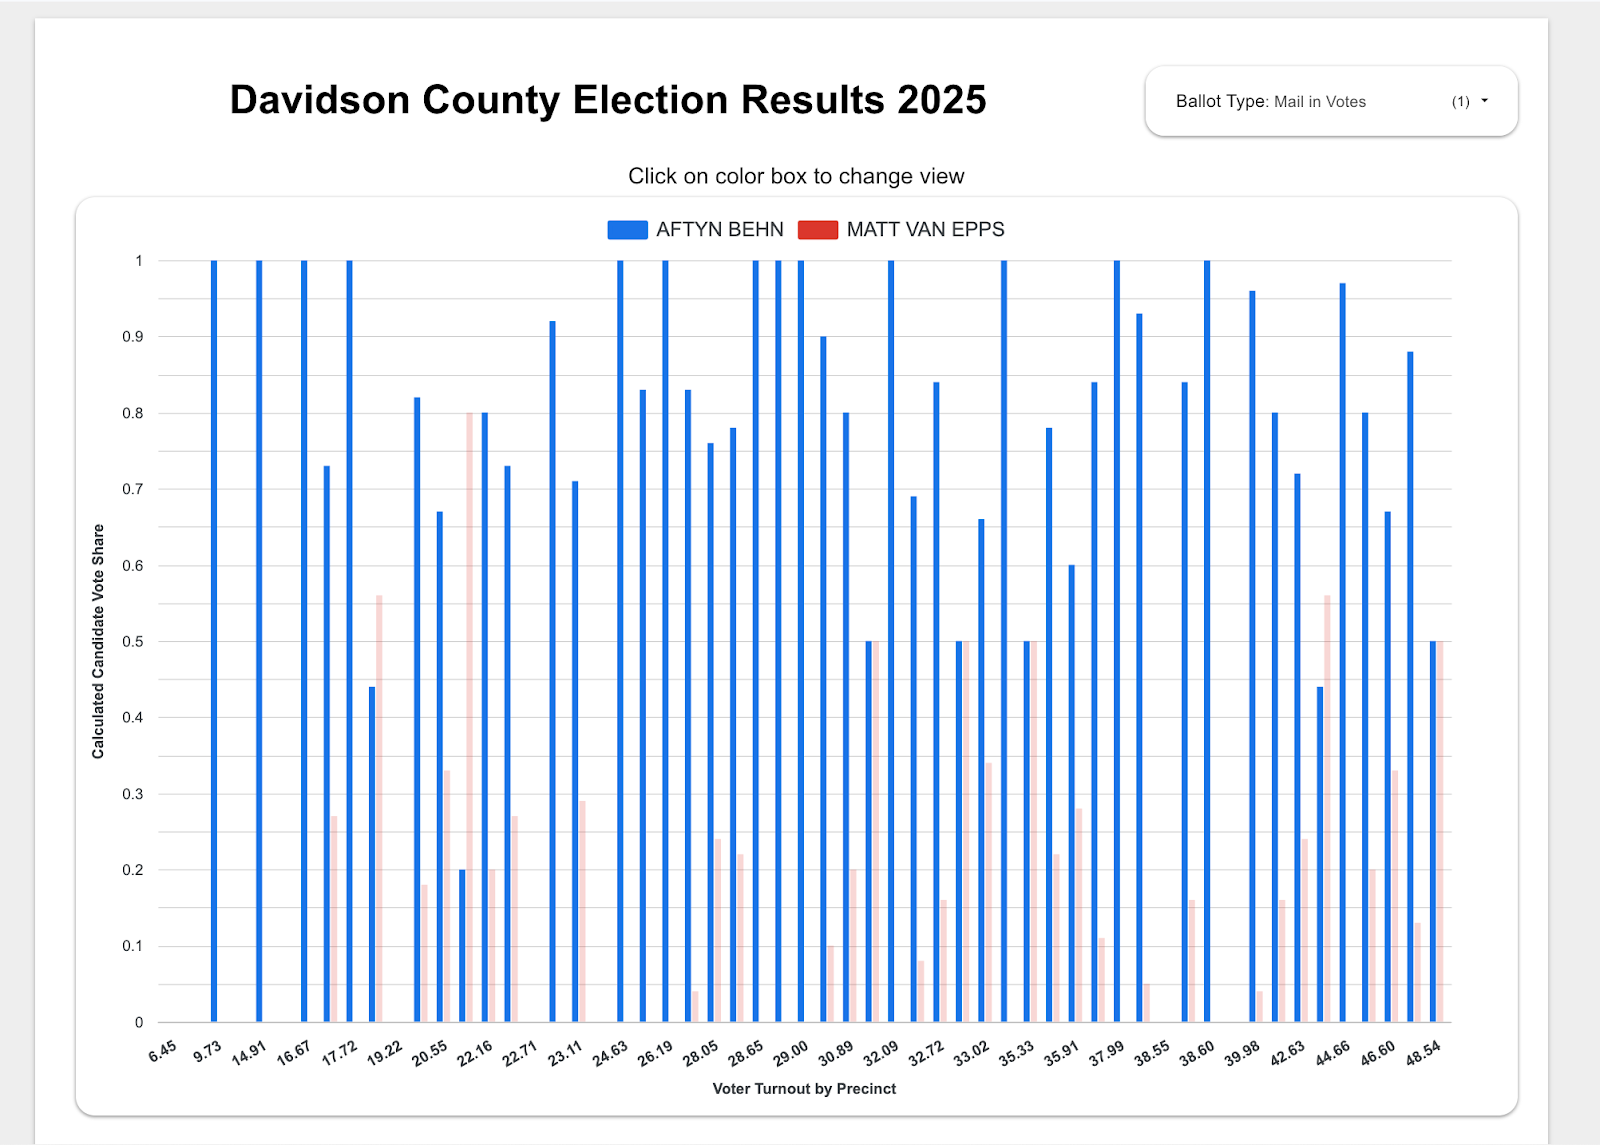
Mail-in Voting - Behn
Mail-in Voting has at least one unusual data point. Behn receives 100% of the vote in thirteen precincts, however they are small precincts that contain from one to ten ballots.
Here are some of the thirteen 100% Behn precincts:
0202: 6 votes
0203: 4 votes
0306: 6 votes
1703: 1 vote
2104: 10 votes
Because these are such a small number of votes, our statistical advisor was not concerned that there was anything unusual about the 100% vote share in these precincts.
Mail-in Voting Van Epps
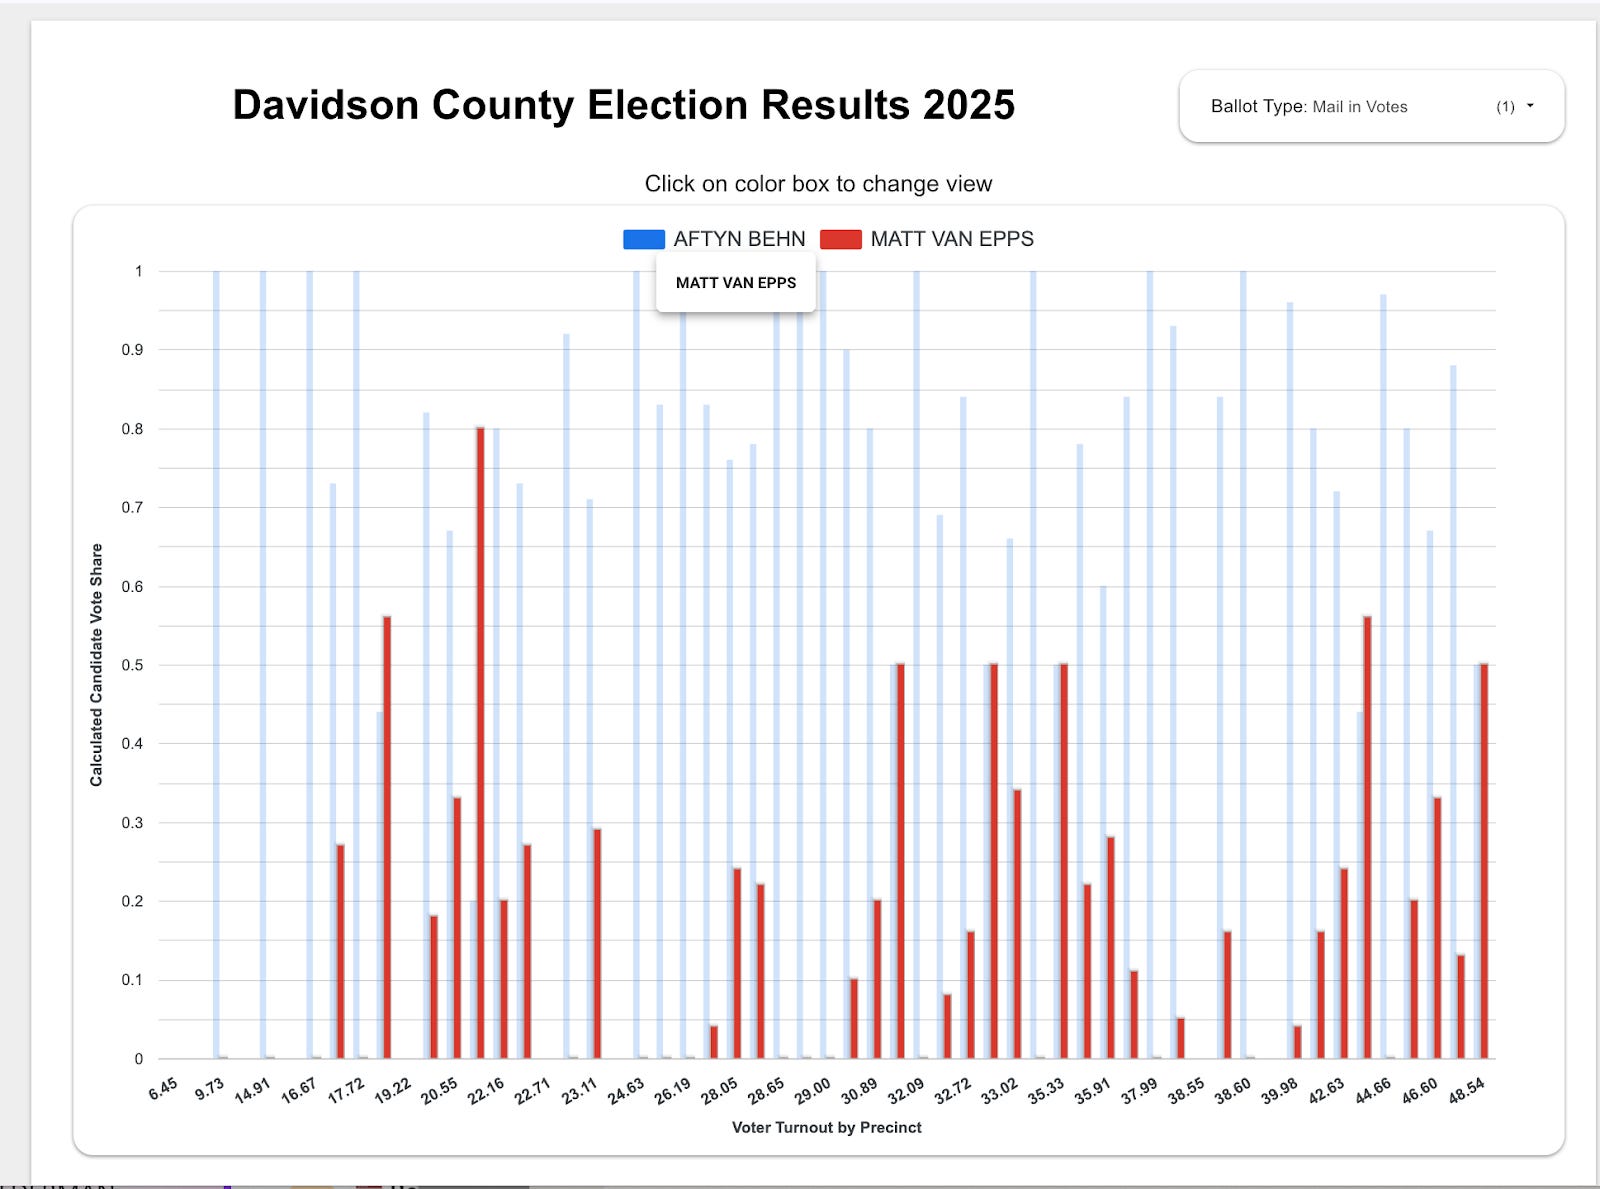
Mail-in Voting - No Visible Correlation to Voter Turnout
Mail-in Voting does not seem to exhibit the same correlation to turnout that Early and Election Day Voting have. Both Behn and Van Epps do well in some precincts and less well in others, with no obvious correlation as the turnout increases.
Other Counties In This Election Exhibit These Same Patterns
Here is Robertson County. We see the same pattern, as the turnout increases, Van Epps does better, Behn does worse.
Here is Houston County. The pattern is less pronounced, but on Election Day, Van Epps does much better as the turnout increases.
We Recommend Behn Challenge These Election Results
We recommend a hand recount of this election that has had no audit so far. There is no way to get a hand recount unless she challenges the election.
Call or text her campaign office at 615-913-5993 or email team@aftynbehn.com
In order to increase public confidence in elections. We ask that the audit be fully open to the public for observation in such a way that observers can actually view each ballot and confirm how the vote was cast.
There are many ways of doing this. Our favorite hand-count technique was developed by Wisconsin Election Integrity and involves projecting the ballot onto the wall or a screen with a document projector so that everyone in the room can view the ballot. (Our interview with Kari McKim, a government auditor who developed this system is at that link starting at 35:32.)
The process can, and should be, livestreamed.
No one but those conducting the audit ever have to touch the ballots.
It is better if the audit is conducted by a neutral oversight agency, and not the officials who did the original count.
No one can truly audit themselves, and the fact that election officials routinely audit themselves does not follow best practices for oversight.
See: Government Auditing Standards, Amendment No. 3, Independence: 3.11
“In all matters relating to the audit work, the audit organization and the individual auditor, whether government or public, should be free both in fact and appearance from personal, external, and organizational impairments to independence.”
Date to Challenge Has Not Passed.
We previously stated that the election had to be challenged by December 10th. We got a revision of this estimate from a Tennessee legal expert who said that the certification data to start the 5-day clock could be the state certification, instead of the county certification, which would give more time before the challenge deadline. He also said that the 5 days are business days and that weekends and holidays don’t count. So we believe there is still a window for her to challenge, but it’s closing quickly.
View Our Full Report on the District 7 Tennessee Special Election
View our full report so far on the Tennessee Special Election
Please Donate & Subscribe
We are gaining a better understanding what happened in previous election cycles, as we put protections in place for the 2026 midterms. If you find our work valuable, please subscribe and make a donation as well! All donations are tax-deductible.
We’re trying to raise $200,000
We are currently in a fundraising drive to raise $200,000 by January 2026 to protect the midterms, support our current work such as this investigation, and file more lawsuits. You can help.
Thanks for all that you do!
Think for yourself, or others will think for you without thinking of you.
~ Henry David Thoreau
 | A guest post by
|
You worked so hard in Tennessee to point out the anomalies in voting behaviour which looked suspicious and should be investigated. And yet Aftyn Behn's silence has been deafening. Not only that, the entire Democratic Party has also looked the other way. Again!
My question is: if they're not interested now, then why would they behave differently in the midterms? And why would the Republicans need to change their tactics? When they got away with their "shenanigans" last November, it wasn't just because of their brilliant scheme; it was also down to Democratic apathy. And that gave the Republicans the green light to try again. And true to form, in the Tennessee Special Election the Democrats did the only thing they know how: waved a white flag, shrugged their shoulders and walked away in defeat.
It doesn't take a genius to predict how both sides will behave in the midterms.
From what I've gleaned, this has been taking place in some form or another for a long time, although the current algorithm-changing software method is superior to anything they've tried before. And soon the Republicans will ring-fence all elections so tightly, that even if the Democratic Party grew a spine (and that's a big if), there won't be a legal avenue in which to contest future fraudulent results.
Why are we still rooting for a Party that's let us down so badly time and time again? Well, that's an easy one to answer: because in a two-party system, disappointing and lily-livered beats corrupt and cruel any day.
Have people been voting for Democrats because they inspire confidence? I don't think they have. They vote for them because the other option is so unpalatable.
We're pretty certain Kamala won by a fairly huge majority, and that may have been the Democrats' last chance to save America's democracy. If that's the case, then they only have themselves to blame if hereon in they never win another election.
Having said all that, I'm still a glass half-full person. Yes, their spineless antics have pissed me off no end, and I'd like to shake some sense into the lot of them. But I have to believe that deep inside the Party there's a reckoning going on... younger members will kick the old guard into touch and hope will spring eternal.
Really disappointed they didn't feel the need to call for a recount.